Custom Amazon Reports with GraphQL API
Build custom Amazon product reports with Canopy's GraphQL API — fetch prices, reviews, ratings, visualize with Chart.js, and export CSV/PDF.

Custom Amazon Reports with GraphQL API
Custom Amazon reports are powerful tools for sellers to track essential metrics like competitor pricing, customer reviews, and product rankings. By leveraging the Canopy API's GraphQL endpoint, you can access real-time Amazon data efficiently and tailor it to your needs. Unlike traditional REST APIs, GraphQL allows you to fetch only the data you require in a single request, saving time and resources.
Key Takeaways:
- Why It Matters: Custom reports help sellers adjust strategies based on competitor stock, pricing trends, and customer feedback.
- Core Tool: Canopy API's GraphQL endpoint (
https://graphql.canopyapi.co/) provides real-time data like product details, prices, and reviews. - Setup Steps:
- Create a Canopy API account and get your API key.
- Use tools like Node.js and Apollo Client for queries.
- Secure your API key with environment variables.
- Data Insights: Fetch detailed Amazon product data, including titles, prices, reviews, and ratings, using structured GraphQL queries.
- Visualization: Use charting libraries like Chart.js to turn data into actionable visuals.
This guide walks you through setting up your environment, writing GraphQL queries, and creating reports that can be exported as CSV or PDF files. Whether you're a small business or large enterprise, this approach simplifies data analysis and helps you make informed decisions.
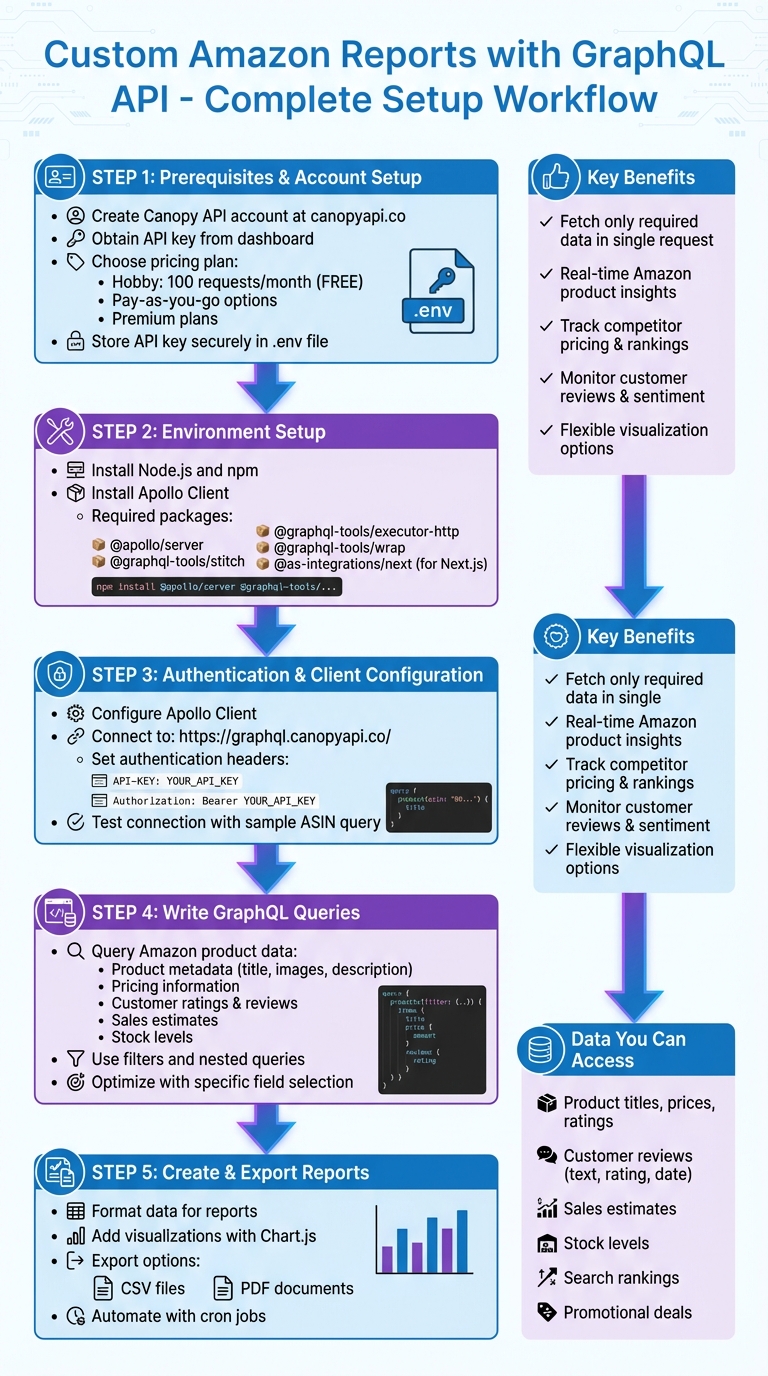
Setting Up Custom Amazon Reports with Canopy API GraphQL - Complete Workflow
Prerequisites for Using Canopy API
Creating Your Canopy API Account
Getting started with the Canopy API is simple. First, visit the Canopy API website and sign up for an account. Once logged in, navigate to your product dashboard to find your API key. This key acts as your unique authentication credential for every request you make, so keep it secure - treat it like a password and avoid sharing it publicly.
Canopy API provides flexible pricing options, ranging from a free Hobby plan (offering 100 monthly requests) to pay-as-you-go and premium plans. After securing your API key, review the pricing documentation to understand the available plans and choose one that fits your needs.
To make requests to the GraphQL endpoint (https://graphql.canopyapi.co/), include your API key in the request headers. You can use either the API-KEY header format or the Authorization: Bearer YOUR_API_KEY format - both work the same way. Avoid hardcoding your API key into client-side code for production applications, as this can expose it to anyone inspecting your site's source code. Instead, store your key in environment variables and handle API calls on the server side.
Your API key is an essential part of authenticating requests, so keep it safe. Once this step is complete, you’re ready to set up the required tools and libraries.
Tools and Libraries You'll Need
After obtaining your API key, it’s time to prepare your development environment. Start by installing Node.js and npm, which are essential for building custom reports. You’ll also need Apollo Client, a tool designed to make managing GraphQL queries easier and more efficient.
Install the following through npm:
- Node.js and npm: Core tools for JavaScript development.
- Apollo Client: Simplifies working with GraphQL.
- Additional packages:
@apollo/server@graphql-tools/stitch@graphql-tools/executor-http@graphql-tools/wrap- For Next.js projects:
@as-integrations/next
With these tools installed, your environment will be ready to handle GraphQL queries and work seamlessly with the Canopy API.
Setting Up Authentication and Client in JavaScript
Getting Your API Keys
To get started, you'll need your API key from the Canopy API dashboard. This key is essential for authenticating every request to the GraphQL endpoint: https://graphql.canopyapi.co/. You can include it in your HTTP headers using either of these formats: API-KEY: YOUR_API_KEY or Authorization: Bearer YOUR_API_KEY.
For security, store your API key in environment variables. In your project's root directory, create a .env file and add the following line:
CANOPY_API_KEY=<YOUR_API_KEY>
Once your API key is securely stored, you're ready to configure the Apollo client.
Installing and Setting Up Apollo Client
Apollo Client is a powerful tool for working with GraphQL. It handles caching, state management, and network requests, making your life much easier. To get started, install the required packages using npm:
npm install @apollo/client graphql
Now, set up the client to connect to the Canopy API's GraphQL endpoint. Create a file named apolloClient.js and configure it with the following code:
import { ApolloClient, InMemoryCache, HttpLink } from '@apollo/client';

const httpLink = new HttpLink({
  uri: 'https://graphql.canopyapi.co/',
  headers: {
    'Authorization': `Bearer ${process.env.CANOPY_API_KEY}`,
    'Content-Type': 'application/json'
  }
});

const client = new ApolloClient({
  link: httpLink,
  cache: new InMemoryCache()
});

export default client;
Here, HttpLink sets up the connection to the API, while InMemoryCache ensures efficient caching of query results.
Testing Your Connection
With the client configured, it's time to test the connection. Create a test file to query a known Amazon product using its ASIN:
import client from './apolloClient.js';
import { gql } from '@apollo/client';

const TEST_QUERY = gql`
  query TestConnection {
    product(asin: "B0B3JBVDYP") {
      title
      price
    }
  }
`;

async function testConnection() {
  try {
    const { data } = await client.query({
      query: TEST_QUERY
    });

    console.log('Connection successful!');
    console.log('Product title:', data.product.title);
    console.log('Price:', data.product.price);
  } catch (error) {
    console.error('Connection failed:', error.message);
  }
}

testConnection();
Run the script with the command node testConnection.js. If you encounter any errors, double-check that your API key is correctly stored in the .env file and that the Authorization header is formatted properly. For testing purposes, the Hobby tier provides 100 free monthly requests - plenty to get you started during development.
Writing GraphQL Queries for Amazon Product Data
Understanding the Canopy API GraphQL Schema
The Canopy API schema organizes Amazon product data into key types, making it easier to query specific information. The main query you'll use is amazonProduct, which takes an input object containing the product's ASIN (Amazon Standard Identification Number).
The schema divides data into logical sections. For example:
- Product Metadata: Includes fields like
title,mainImageUrl, anddescription. - Pricing Information: Found under the
priceobject, with fields likedisplayfor formatted prices. - Social Proof: Contains fields such as
ratingandreviews. - Market Insights: Provides AI-driven sales estimates and stock levels.
You can explore the full schema using GraphQL introspection or by checking the documentation at docs.canopyapi.co.
Now, let’s see how to apply this schema knowledge when writing queries.
Writing Your First Queries
With the schema in mind, here's an example of a basic query to fetch product details:
import client from './apolloClient.js';
import { gql } from '@apollo/client';

const PRODUCT_QUERY = gql`
  query GetProductDetails($asin: String!) {
    amazonProduct(input: {asin: $asin}) {
      title
      mainImageUrl
      rating
      price {
        display
      }
    }
  }
`;

async function fetchProductData(asin) {
  const { data } = await client.query({
    query: PRODUCT_QUERY,
    variables: { asin }
  });

  console.log('Product:', data.amazonProduct.title);
  console.log('Price:', data.amazonProduct.price.display);
  console.log('Rating:', data.amazonProduct.rating);
}

fetchProductData('B08N5WRWNW');
Using query variables makes your queries reusable and adaptable to different inputs. This simple query lays the groundwork for more advanced product reports.
Want to dive deeper? Here’s how you can fetch customer reviews:
const REVIEWS_QUERY = gql`
  query GetProductWithReviews($asin: String!) {
    amazonProduct(input: {asin: $asin}) {
      title
      reviews(first: 10) {
        edges {
          node {
            text
            rating
            date
          }
        }
      }
    }
  }
`;
This query retrieves the first 10 reviews, including details like text, rating, and date (formatted as MM/DD/YYYY). Perfect for sentiment analysis or customer feedback insights.
Using Filters and Nested Queries
GraphQL allows you to request only the data you need, keeping responses efficient. For example:
const COMPREHENSIVE_QUERY = gql`
  query ComprehensiveProductReport($asin: String!) {
    amazonProduct(input: {asin: $asin}) {
      title
      description
      mainImageUrl
      rating
      price {
        display
      }
      reviews(first: 5) {
        edges {
          node {
            text
            rating
            date
          }
        }
      }
    }
  }
`;
This query combines metadata, pricing, and reviews into one streamlined request. By specifying fields like price { display } instead of pulling the entire price object, you can optimize performance and tailor the data to your needs.
For more complex scenarios, such as market analysis, you can use specialized queries. For instance:
- Search API: Filters products by keywords and rankings, ideal for competitor analysis.
- Deals API: Tracks live promotions and discounts.
By nesting these queries, you can create detailed business intelligence reports that monitor product titles, prices, stock levels, and market trends.
Before adding these queries to your JavaScript app, test them in tools like Hoppscotch to ensure the structure and responses match your expectations.
Fetching and Processing Data for Custom Reports
Running Queries in JavaScript
To fetch Amazon product data, you can use GraphQL queries with the Apollo Client. This tool simplifies data fetching by managing loading and error states for you. Here's an example of how to query multiple products for a comparative report:
import client from './apolloClient.js';
import { gql } from '@apollo/client';

const MULTI_PRODUCT_QUERY = gql`
  query GetMultipleProducts($asins: [String!]!) {
    products: amazonProduct(input: {asin: $asins}) {
      title
      rating
      price {
        display
      }
      salesEstimate
    }
  }
`;

async function fetchReportData(asins) {
  try {
    const { data, loading, error } = await client.query({
      query: MULTI_PRODUCT_QUERY,
      variables: { asins },
      errorPolicy: 'all'
    });

    if (loading) console.log('Fetching data...');
    if (error) console.error('GraphQL Error:', error.message);

    return data;
  } catch (err) {
    console.error('Network Error:', err);
    return null;
  }
}

const productASINs = ['B08N5WRWNW', 'B07XJ8C8F5', 'B09G9FPHY6'];
fetchReportData(productASINs);
When building production reports, always prioritize error handling. Even if the HTTP status is 200, verify the response for any issues. For network-related problems, consider implementing retry logic. To enhance security and reliability, execute these queries server-side using platforms like Node.js or Next.js API routes, and ensure your credentials are stored securely.
Once you fetch the raw data, the next step is to process and format it into actionable insights for your reports.
Formatting Data for Your Reports
After retrieving the data, it's crucial to organize it for clarity and accuracy. GraphQL typically returns nested JSON responses, so you'll need to flatten and format this data for better readability, especially for US-localized reports.
Here’s an example of how to transform the raw data into a report-friendly format:
function formatProductData(rawData) {
  return rawData.products.map(product => ({
    productName: product.title,
    customerRating: product.rating ? product.rating.toFixed(1) : 'N/A',
    price: product.price?.display || '$0.00',
    estimatedMonthlySales: product.salesEstimate
      ? product.salesEstimate.toLocaleString('en-US')
      : '0',
    lastUpdated: new Date().toLocaleDateString('en-US')
  }));
}

// Usage
const formattedData = formatProductData(fetchedData);
console.table(formattedData);
This method uses optional chaining (?.) to safely access properties, ensuring the code doesn't break if certain fields are missing. Additionally, all values are formatted for US localization, such as currency (e.g., $1,234.56) and dates (MM/DD/YYYY).
For reports that require aggregated metrics like totals or averages, you can calculate them as follows:
function calculateReportMetrics(products) {
  const totalProducts = products.length;
  const avgRating = products.reduce((sum, p) => sum + (p.rating || 0), 0) / totalProducts;
  const totalEstimatedSales = products.reduce((sum, p) => sum + (p.salesEstimate || 0), 0);

  return {
    totalProducts,
    averageRating: avgRating.toFixed(2),
    totalEstimatedMonthlySales: totalEstimatedSales.toLocaleString('en-US'),
    reportGeneratedOn: new Date().toLocaleString('en-US')
  };
}
Once your data is formatted and metrics are calculated, you can visualize it using charting libraries or export it to a CSV file for further analysis. This ensures your reports are not only accurate but also easy to interpret.
sbb-itb-d082ab0
Creating and Visualizing Custom Reports with JavaScript
Designing Report Templates
After formatting your data, the next step is to create report structures tailored to your business needs. These could include price trackers to monitor competitor pricing, inventory monitoring tools for tracking stock levels, review sentiment analysis to identify customer concerns, or competitor search ranking reports to gauge product performance in search results.
When designing templates, focus on efficient data retrieval. For example, if you're creating a sales trend report, query only the price and salesEstimate fields instead of fetching the entire product object. This approach minimizes data load and speeds up report generation.
Here’s a simple example of a competitive pricing dashboard template:
function createPricingReportTemplate(products) {
  return {
    reportTitle: 'Competitive Pricing Analysis',
    generatedAt: new Date().toLocaleString('en-US'),
    summary: {
      productsTracked: products.length,
      lowestPrice: Math.min(...products.map(p => parseFloat(p.price.replace(/[$,]/g, '')))),
      highestPrice: Math.max(...products.map(p => parseFloat(p.price.replace(/[$,]/g, ''))))
    },
    products: products.map(p => ({
      asin: p.asin,
      name: p.productName,
      currentPrice: p.price,
      rating: p.customerRating,
      monthlySales: p.estimatedMonthlySales
    }))
  };
}
This structure organizes your data effectively, with a summary section for quick insights and detailed product information for deeper analysis. Once your report structure is ready, the next step is to bring your data to life with visuals.
Adding Charts with JavaScript Libraries
With your templates in place, turn raw data into meaningful visuals. Tools like Chart.js are great for standard dashboards, while LightningChart JS handles high-volume datasets.
Here’s how you can create a bar chart to compare sales using Chart.js:
import Chart from 'chart.js/auto';

function createSalesChart(products, canvasId) {
  const ctx = document.getElementById(canvasId).getContext('2d');

  new Chart(ctx, {
    type: 'bar',
    data: {
      labels: products.map(p => p.productName.substring(0, 30) + '...'),
      datasets: [{
        label: 'Estimated Monthly Sales',
        data: products.map(p => parseInt(p.estimatedMonthlySales.replace(/,/g, ''))),
        backgroundColor: 'rgba(54, 162, 235, 0.6)',
        borderColor: 'rgba(54, 162, 235, 1)',
        borderWidth: 1
      }]
    },
    options: {
      responsive: true,
      scales: {
        y: {
          beginAtZero: true,
          ticks: {
            callback: function(value) {
              return value.toLocaleString('en-US');
            }
          }
        }
      }
    }
  });
}
For tracking trends over time, such as inventory levels or sales patterns, consider using line charts. These can illustrate changes across days or weeks, providing a clear view of fluctuations.
Exporting Your Reports
Once your reports are ready, you can export them as CSV or PDF files for easy sharing and archiving.
To export data as a CSV file:
function exportToCSV(products, filename) {
  const headers = ['Product Name', 'ASIN', 'Price', 'Rating', 'Monthly Sales', 'Last Updated'];
  const rows = products.map(p => [
    `"${p.productName}"`,
    p.asin,
    p.price,
    p.customerRating,
    p.estimatedMonthlySales,
    p.lastUpdated
  ]);

  const csvContent = [
    headers.join(','),
    ...rows.map(row => row.join(','))
  ].join('\n');

  const blob = new Blob([csvContent], { type: 'text/csv;charset=utf-8;' });
  const link = document.createElement('a');
  link.href = URL.createObjectURL(blob);
  link.download = `${filename}_${new Date().toLocaleDateString('en-US').replace(/\//g, '-')}.csv`;
  link.click();
}
To export reports as PDFs, especially if they include charts, use jsPDF along with html2canvas:
import jsPDF from 'jspdf';
import html2canvas from 'html2canvas';

async function exportToPDF(elementId, filename) {
  const element = document.getElementById(elementId);
  const canvas = await html2canvas(element, { scale: 2 });
  const imgData = canvas.toDataURL('image/png');

  const pdf = new jsPDF('p', 'mm', 'letter');
  const imgWidth = 210;
  const imgHeight = (canvas.height * imgWidth) / canvas.width;

  pdf.addImage(imgData, 'PNG', 0, 0, imgWidth, imgHeight);
  pdf.save(`${filename}_${new Date().toLocaleDateString('en-US').replace(/\//g, '-')}.pdf`);
}
Before finalizing a PDF export, preview the document to ensure all data fits within the page. If some information is cut off, try reducing the time range or applying filters to make the content more concise. For automated workflows, consider scheduling report generation on your server using cron jobs, enabling regular updates without manual effort.
Summary and Next Steps
Review of the Process
This guide walks you through the entire process of creating custom Amazon reports using the Canopy API's GraphQL endpoint. You start by setting up your JavaScript environment, installing Apollo Client, and directing requests to https://graphql.canopyapi.co/ with the appropriate authentication headers.
One of the key advantages of GraphQL is its ability to fetch only the exact data you need - like price, customerRating, or estimatedMonthlySales. Once you have the data, you can format it, add visual elements using Chart.js, and export the reports for further analysis. This workflow simplifies the process and helps you build reports that are both accurate and actionable.
How to Continue Building
Now that you understand the basics, it's time to take your reporting to the next level. Experiment with creating different types of reports. For instance, you could develop a competitor price tracker to monitor specific ASINs daily or design a review sentiment dashboard to identify products with declining ratings. The wide range of available data opens the door to countless possibilities.
As your projects grow, remember to prioritize security and scalability. For production-level applications, move API calls to a backend server (using Node.js or Python) to keep your API key secure - never expose it in browser-based code. If you're working on smaller projects, the Hobby plan (which includes 100 monthly requests) is a great way to get started. Shifting API calls server-side and exploring advanced visualization tools are smart steps as you scale.
For more advanced features and integration options, check out the Canopy API documentation. You'll find helpful resources like examples for the Amazon Search API (for keyword rankings) and the Amazon Deals API (for tracking promotions). Canopy also provides open-source examples and guides for integrating with tools like GraphQL Yoga and Apollo Server, making it easier to build robust, production-ready reporting systems.
Build a GraphQL Apollo Server with Node.js, Prisma, and SQLite
FAQs
What makes GraphQL different from REST APIs when building custom Amazon reports?
GraphQL makes generating custom Amazon reports much more efficient. Instead of juggling multiple endpoint calls like you would with REST APIs - often resulting in either too much or too little data - GraphQL lets you send a single query to fetch exactly what you need.
This not only simplifies the process but also saves time and ensures your reports are precise, with no extra data cluttering things up.
How should I securely manage my Canopy API key?
Your Canopy API key is sensitive and requires careful handling to keep it secure. Always store it in a safe location on the server side, such as within environment variables or a secrets manager. Never include it in client-side code or commit it to a version control system. When making server-to-server requests, include the key in the Authorization header.
Exposing the API key in the browser, even for testing, can create significant security vulnerabilities. In production, make sure the key is only accessible to trusted systems, and restrict its usage to the smallest scope necessary for your application to function.
How do I create a chart to visualize Amazon product data using Chart.js?
To visualize Amazon product data using Canopy's GraphQL API and Chart.js, follow these steps:
-
Start by including Chart.js in your HTML file. Then, query product details - such as the title, price, and rating - from the API. Make sure to replace
<YOUR_API_KEY>with your actual API key and specify the desired ASIN to pull the product information. - Once you retrieve the data, format the price in US currency for better readability. Next, prepare the chart labels (like "Price" and "Rating") and their corresponding values.
-
Use a
<canvas>element in your HTML as the container for the chart. Then, initialize a Chart.js bar chart to showcase the product's price and rating side-by-side.
This approach provides a simple yet effective way to display Amazon product data in real time with a clean and customizable chart layout.