How to Use APIs for Amazon Category Sales Insights
Fetch and analyze Amazon category sales with REST and GraphQL APIs; includes JavaScript examples, key metrics, and dashboard tips for better inventory and pricing.

How to Use APIs for Amazon Category Sales Insights
Want to understand Amazon's sales trends across categories like "Electronics" or "Home & Kitchen"? Here's how APIs can help.
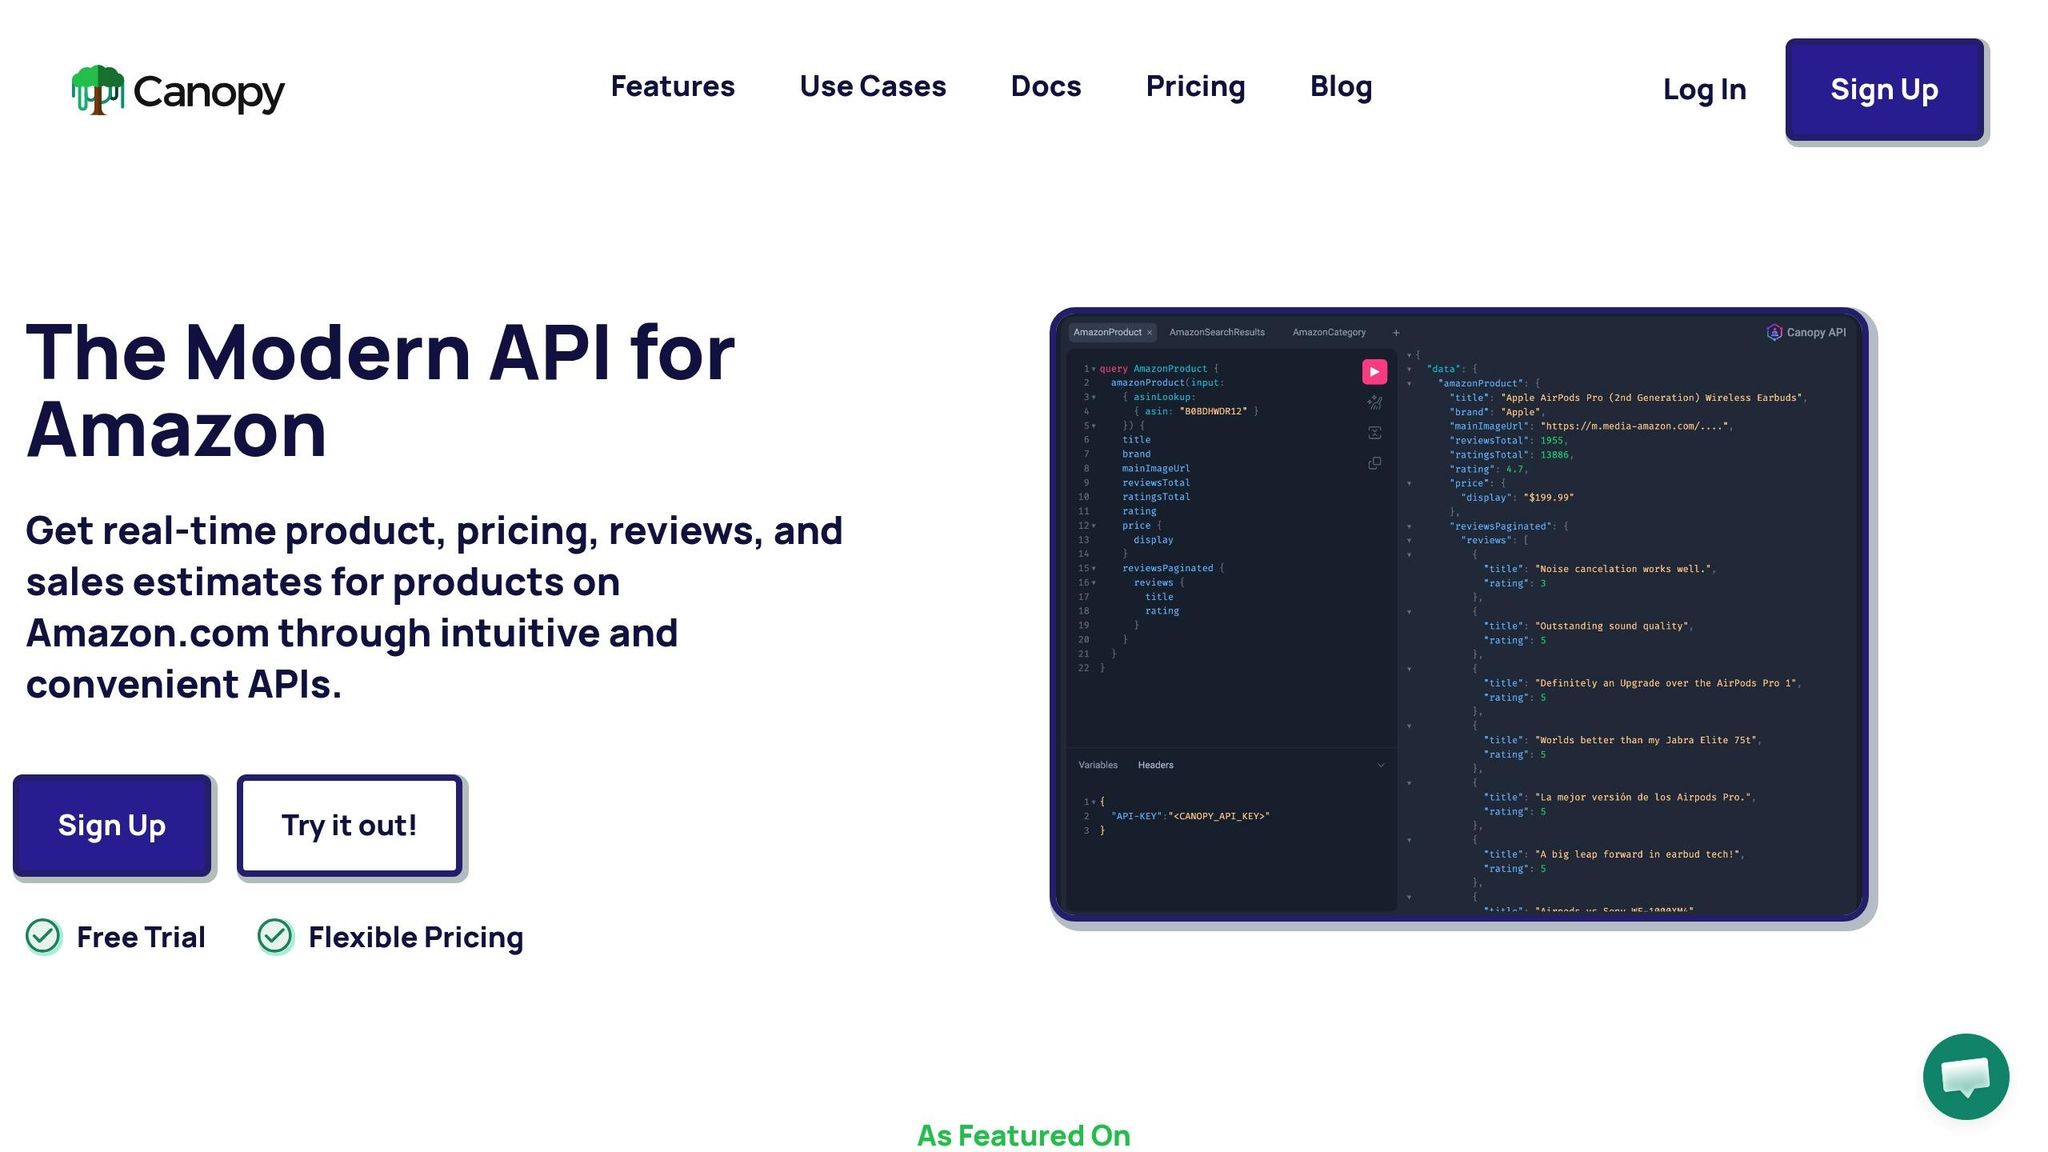
By leveraging tools like the Canopy API, you can access real-time data for over 25,000 Amazon categories and 350 million products. This data reveals sales estimates, pricing trends, review activity, and more - helping sellers identify profitable niches, plan inventory, and analyze competitors.
Key Highlights:
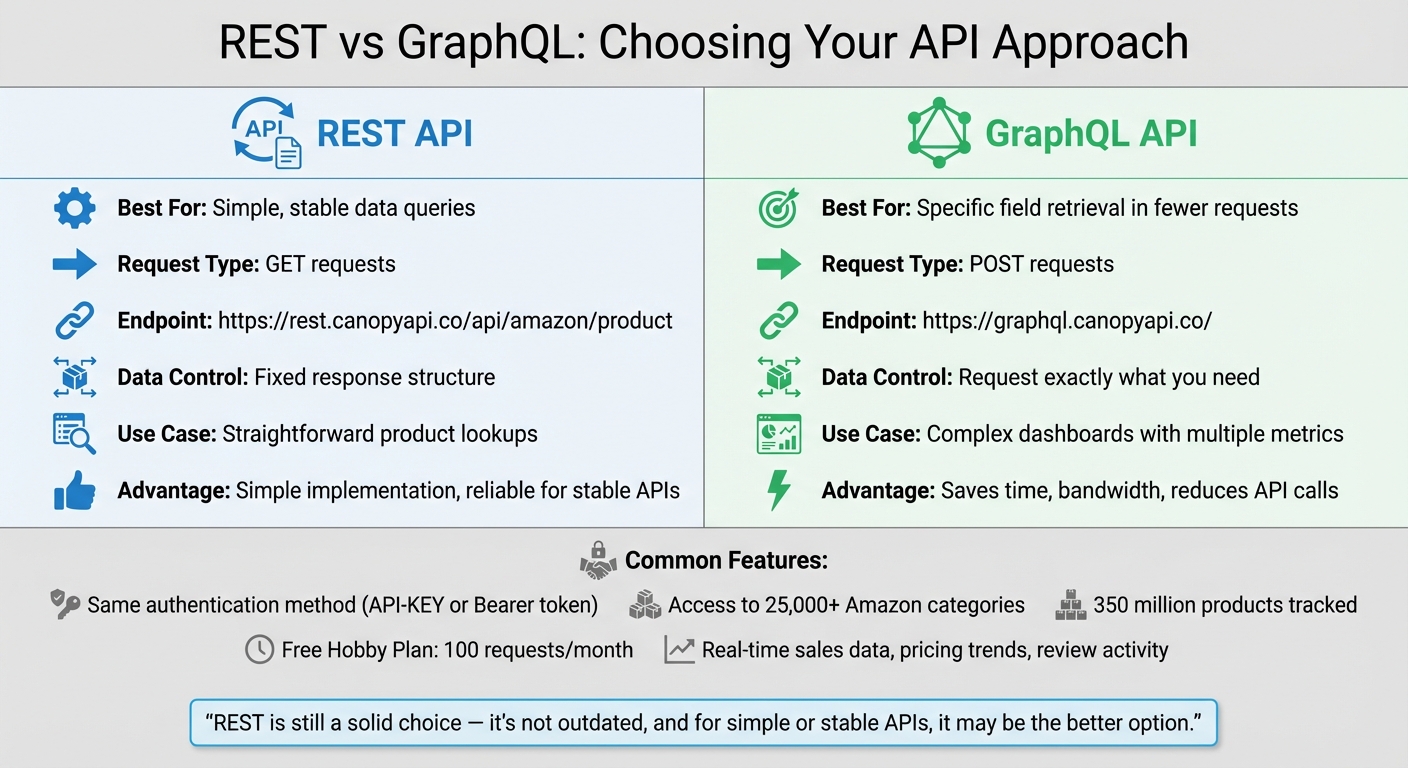
- REST API: Ideal for simple, stable data queries.
- GraphQL API: Perfect for retrieving specific fields in fewer requests, saving time and bandwidth.
- Free Plan: Start with 100 monthly requests at no cost.
With JavaScript examples provided, you’ll learn how to fetch and analyze category data to improve your Amazon strategy. Keep your API key secure, and let data guide your decisions.
Setting Up Canopy API
REST vs GraphQL API Comparison for Amazon Sales Data
Creating Your Account
To get started, head to the Canopy API website and create an account using your email and password. The Hobby plan is completely free and includes 100 requests per month, making it ideal for testing or small-scale projects. You can always upgrade later if your needs expand, but the free tier provides full access to all features - no credit card required.
Generating Your API Key
Once you're logged in, your API key will be displayed on your dashboard. Make sure to copy and store it securely. Never share your API key or include it in public repositories like GitHub. When making API requests, include your key in the request headers as either API-KEY: YOUR_API_KEY or Authorization: Bearer YOUR_API_KEY. Both formats are compatible with REST and GraphQL endpoints. This key is essential for accessing real-time sales data from Amazon categories.
For testing or proof-of-concept projects, you can use the key in browser-side code. However, for production-level applications, always handle authentication on the server side to avoid unauthorized access.
REST vs. GraphQL: Which to Use
Both REST and GraphQL endpoints use the same authentication method. REST is great for straightforward, stable data needs with standard GET requests. On the other hand, GraphQL is your go-to if you need specific fields in a single POST request. It eliminates the hassle of over-fetching data and reduces the number of API calls required to gather related information.
"REST is still a solid choice - it's not outdated, and for simple or stable APIs, it may be the better option."
If you're building something like a complex dashboard that pulls metrics from multiple product categories, GraphQL's flexibility can save you significant time and reduce the number of API calls. Ultimately, the choice depends on the complexity of your project and how much control you need over the data you retrieve.
Next, we’ll dive into JavaScript code examples to demonstrate how to fetch category sales data using both endpoints.
Using the REST API to Get Category Sales Data
REST API Endpoint and Parameters
The Canopy REST API provides access to Amazon product and sales data through the endpoint: https://rest.canopyapi.co/api/amazon/product. While the API delivers data at the product level, you can combine results from multiple ASINs to estimate performance across categories. The platform monitors over 25,000 Amazon categories, offering extensive coverage of the marketplace.
To make a successful request, you need two key parameters:
asin: The Amazon Standard Identification Number for the product.domain: The marketplace you're targeting, such asUS.
The API response includes real-time sales data like monthly and daily sales figures, revenue, and the product's salesRank. By aggregating this data across multiple ASINs, you can gauge category performance and pinpoint areas with strong demand.
JavaScript Code Example for REST API
Here’s a simple JavaScript function that uses the fetch method to retrieve sales data from the REST API:
async function getAmazonSalesData(asin) {
  const apiKey = '<YOUR_API_KEY>';
  const domain = 'US';
  const url = `https://rest.canopyapi.co/api/amazon/product?asin=${asin}&domain=${domain}`;

  try {
    const response = await fetch(url, {
      method: 'GET',
      headers: {
        'API-KEY': apiKey,
        'Content-Type': 'application/json'
      }
    });

    if (response.ok) {
      const data = await response.json();
      console.log(`Product: ${data.title}`);
      console.log(`Sales Estimate: ${data.salesEstimate}`);
      console.log(`Sales Rank: ${data.salesRank}`);
      return data;
    } else {
      console.error('Request failed with status:', response.status);
    }
  } catch (error) {
    console.error('Fetch error:', error);
  }
}
The response is returned in JSON format, containing details like the product title, price (in USD), sales estimates, stock levels, and review counts. To analyze category trends, run this function for multiple ASINs within the same category, then aggregate the sales estimates to calculate total category volume. Always check response.ok to ensure the request succeeded before parsing the JSON, as this helps catch errors effectively.
This example demonstrates how you can incorporate sales data into a larger analytics system, giving you the tools to better understand trends and opportunities.
Using GraphQL to Get Category Sales Data
Building Your GraphQL Query
GraphQL allows you to request exactly the data you need, giving you more control compared to REST. Instead of receiving a predefined response, you define the fields you want. The Canopy GraphQL endpoint (https://graphql.canopyapi.co/) accepts POST requests with your query and variables included in the request body.
A standard query includes the operation type (query), variables (like $category and $limit), and nested fields that specify the data you’re after. For category sales data, you can request fields such as salesEstimate, which might include details like monthlySales, dailySales, revenue, and trend. This approach reduces bandwidth usage and simplifies data processing. You can also sort results by sales performance using parameters like sortBy: "salesEstimate" to identify the best-performing items in a category.
Here’s an example of a basic GraphQL query to fetch category sales data:
query GetCategorySales($category: String!, $limit: Int) {
  categoryProducts(category: $category, limit: $limit, sortBy: "salesEstimate") {
    totalProducts
    products {
      asin
      title
      price
      salesEstimate {
        monthlySales
        dailySales
        revenue
        trend
      }
      category {
        name
        salesRank
      }
    }
  }
}
Next, let's see how to use JavaScript to execute this query and retrieve the data.
JavaScript Code Example for GraphQL API
To run the GraphQL query, you can use JavaScript's fetch function. The request should include a JSON body containing your query and variables, along with an API key in the headers.
async function getCategorySalesData(category, limit = 10) {
  const apiKey = '<YOUR_API_KEY>';

  const query = `
    query GetCategorySales($category: String!, $limit: Int) {
      categoryProducts(category: $category, limit: $limit, sortBy: "salesEstimate") {
        totalProducts
        products {
          asin
          title
          price
          salesEstimate {
            monthlySales
            revenue
            trend
          }
        }
      }
    }
  `;

  const variables = {
    category: category,
    limit: limit
  };

  try {
    const response = await fetch('https://graphql.canopyapi.co/', {
      method: 'POST',
      headers: {
        'Content-Type': 'application/json',
        'API-KEY': apiKey
      },
      body: JSON.stringify({ query, variables })
    });

    const result = await response.json();

    if (result.errors) {
      console.error('GraphQL errors:', result.errors);
      return null;
    }

    console.log(`Total products in category: ${result.data.categoryProducts.totalProducts}`);

    result.data.categoryProducts.products.forEach(product => {
      console.log(`${product.title}: ${product.salesEstimate.revenue}/month`);
    });

    return result.data;
  } catch (error) {
    console.error('Fetch error:', error);
  }
}

// Example usage
getCategorySalesData('Electronics/Headphones', 10);
The response will be in JSON format, with the requested fields inside the data property. Always check for result.errors before accessing the data to handle any issues. For security, avoid exposing your API key in client-side code. Instead, use environment variables or route requests through a secure backend to protect your credentials.
sbb-itb-d082ab0
Analyzing and Displaying Sales Data
Key Metrics to Track
When analyzing sales data, focus on metrics that directly impact your business decisions. For example, monthly sales estimates are essential for accurate inventory planning and predicting demand. The Best Sellers Rank (BSR) helps you gauge your performance against competitors and spot profitable niches. Similarly, review velocity - how quickly products accumulate feedback - can highlight market acceptance and point to areas for improving product listings.
Another critical metric is sales velocity, which measures how quickly products sell. This insight is invaluable for identifying trending items and planning restocks effectively. Stock estimates, on the other hand, can reveal when competitors are running low, creating opportunities to ramp up advertising. Historical price data is another powerful tool, guiding you in setting competitive prices and planning discounts. Research indicates that using dynamic pricing strategies based on this data can boost profit margins by 15% to 30%.
| Metric | Business Decision Informed |
|---|---|
| Monthly Sales Estimate | Inventory planning and demand forecasting |
| Sales Rank (BSR) | Competitive analysis and niche identification |
| Review Velocity | Product improvement and listing optimization |
| Stock Estimates | Identifying competitor stockouts to adjust ad strategies |
| Historical Price | Competitive pricing and discount planning |
Additionally, tracking FBA counts (Fulfilled by Amazon inventory) provides insights into competitors’ operational strengths and cost advantages. Real-time monitoring of inventory levels can help you act quickly when competitors run out of stock, giving you a chance to capture market share. Tools like the Canopy API, which tracks over 350 million Amazon products across more than 25,000 categories, offer a wealth of data for making informed decisions.
Next, let’s explore how to transform these metrics into actionable insights using a well-designed sales dashboard.
Building a Sales Dashboard
Using the real-time data provided by Canopy API, you can create a dashboard to monitor performance and uncover opportunities. Tools like Chart.js make it easy to visualize data, while offering options to export reports in formats like CSV or PDF for stakeholder review. A well-constructed dashboard should showcase key metrics such as category performance, estimated sales, and growth rates.
To ensure security and efficiency, always handle API requests on the server side to protect your API key. Use GraphQL queries to pull only the specific fields your dashboard needs - such as price, rating, and salesEstimate. This streamlined approach keeps your dashboard responsive and minimizes costs.
Conclusion
This guide walked you through integrating the Canopy API to gain actionable insights into Amazon category sales. Whether you're accessing data through the REST endpoint for straightforward product lookups or the GraphQL endpoint for more tailored queries, the process is designed to be seamless. By starting with an account at canopyapi.co and generating your API key, you’re set to securely access real-time sales data.
With the integration in place, you can monitor key metrics like sales estimates, pricing trends, and stock levels. These insights empower you to make informed decisions about inventory planning, competitive pricing, and spotting new market opportunities. The JavaScript examples provided here serve as a starting point for creating dashboards that visualize category performance and growth.
For security, remember to keep your API key on the server side to avoid unauthorized access. Start with the free Hobby Plan and scale up as your business needs grow. If you need more help, the documentation at docs.canopyapi.co includes detailed guides and open-source examples to speed up your development process.
A little inspiration to guide your strategy:
"Time is a precious resource, do not spend it maintaining your Amazon scraper, build your product!" - Canopy API
FAQs
What’s the difference between using REST and GraphQL APIs for accessing Amazon sales data?
The decision between using REST or GraphQL APIs comes down to your specific data requirements and workflow.
REST APIs are straightforward and widely adopted, making them a solid choice for simpler tasks. For example, if you're retrieving product details or sales data with standard HTTP methods, REST works perfectly. A quick GET request can fetch basic information without much hassle.
GraphQL, however, shines when dealing with more complex or dynamic queries. It lets you specify exactly what data fields you need in a single request, reducing unnecessary data transfer and saving time. This makes GraphQL particularly useful for applications like generating detailed sales trend reports or tracking real-time price updates. Both approaches are well-supported, so the best choice depends on the complexity of your project and your technical preferences.
How can I keep my API key secure when using the Canopy API?
To keep your Canopy API key secure, it's important to follow these key practices:
- Keep your API key private: Never share it publicly or with anyone who shouldn't have access. Exposing your key could lead to unauthorized use or security issues.
- Avoid embedding your API key in code: Storing the key directly in your code, especially in client-side applications or production environments, is risky. Instead, use secure methods like environment variables or secrets management tools to keep it safe.
- Limit how your API key can be used: Restrict its usage to specific IP addresses, referrer URLs, or endpoints. This adds an extra layer of security in case the key is compromised.
Taking these precautions helps protect your API key, secure your data, and ensure your integrations remain reliable.
What metrics should I track to improve my Amazon sales performance?
Tracking the right metrics is a game-changer when it comes to improving your Amazon sales performance. These key metrics can guide your decisions and help you stay ahead:
- Search rankings: Keep an eye on where your products land in search results. This helps you fine-tune keywords and improve visibility.
- Sales estimates and velocity: These metrics reveal demand patterns, making it easier to plan inventory and adjust pricing strategies effectively.
- Buy Box percentage and conversion rate: Monitoring these gives you a clear picture of your competitive standing and highlights areas where you can improve.
- Advertising efficiency: Metrics like Total Advertising Cost of Sales (TACoS) show how well your marketing dollars are working for you.
- Inventory performance: Staying on top of stock levels ensures you avoid stockouts or overstocking, keeping operations smooth and customers happy.
By focusing on these metrics, you can make smarter, data-backed decisions that enhance your visibility, boost profits, and drive sales success on Amazon.