Top Metrics for Competitor Sales Estimation
Use BSR, sales velocity, pricing, reviews, FBA counts and inventory tracking to estimate competitor sales on Amazon and improve pricing and restocking decisions.

Top Metrics for Competitor Sales Estimation
Amazon sellers know that staying ahead requires understanding competitor performance. But with no direct access to sales data, how do you estimate their numbers? By tracking key metrics like Best Sellers Rank (BSR), sales velocity, and pricing trends, you can uncover patterns and improve your strategy.
Here’s what you’ll learn:
- BSR: A snapshot of product demand, updated multiple times daily.
- Sales Velocity: Tracks how fast competitors sell items over time.
- Pricing Trends: Shows how price changes affect sales and demand.
- Review Count & Rating: Reflects customer satisfaction and sales momentum.
- FBA Offer Count: Indicates how competition is divided among sellers.
- Inventory Levels: Highlights stock trends and potential gaps.
Tools like the Canopy API simplify tracking these metrics, offering real-time data to help you make smarter decisions. Whether you’re launching a product or optimizing your catalog, these metrics provide a clear edge in a crowded market.
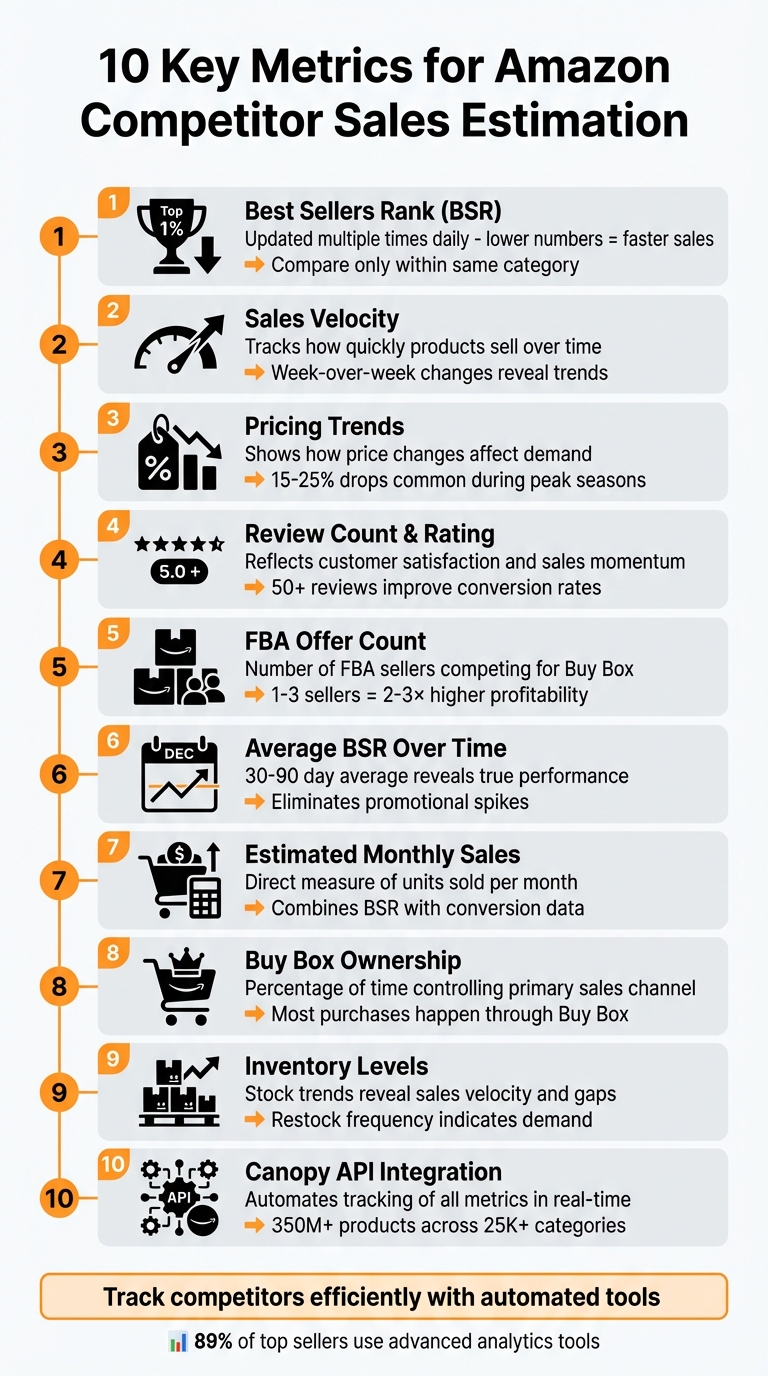
10 Key Metrics for Amazon Competitor Sales Estimation
1. Best Sellers Rank (BSR)
Relevance to Competitor Sales Estimation
The Best Sellers Rank (BSR) is a key metric that ties directly to how quickly a product sells - faster-moving items have lower BSR numbers. Amazon updates this rank multiple times a day based on real-time sales within specific categories and subcategories, making it a dynamic reflection of market demand.
BSR forms the backbone of most sales estimation tools. These tools combine BSR with data like product category and marketplace location to estimate monthly sales volumes. However, it's crucial to compare BSR only within the same category. For instance, a #50 BSR in one category could represent vastly different sales volumes compared to another.
Ease of Data Collection and Tracking
One of the advantages of BSR is its accessibility - it’s publicly displayed on every Amazon product listing. While you can manually track competitor BSR by visiting their product pages, this becomes inefficient when dealing with multiple competitors over time.
To streamline this process, tools like Canopy API offer real-time BSR data through REST and GraphQL endpoints. These tools can fetch not only BSR but also pricing, reviews, and sales estimates in a single request. They even allow you to query specific data fields, ensuring you only get what you need. By integrating such tools into automated workflows, you can continuously monitor competitors and receive alerts for significant ranking shifts.
Impact on Sales Performance Insights
Tracking BSR over time provides a clearer picture of trends that single snapshots might miss. For example, if a competitor’s BSR worsens (increases), it could indicate stock shortages, a loss of Buy Box ownership, or reduced demand. On the other hand, an improving BSR often signals successful marketing campaigns or growing market interest.
Additionally, products with more than 50 reviews tend to convert better, which positively impacts their BSR. The relationship between reviews and sales performance is cyclical - low review counts can hurt BSR, creating challenges that even aggressive advertising might not overcome. This makes it critical to monitor BSR alongside metrics like review count and review velocity to get a full understanding of competitor performance.
Actionability for Competitive Strategies
BSR data can guide strategic decisions like pricing adjustments and inventory planning. Weekly shifts in BSR can act as early signals of market share changes or competitors facing stock issues.
You can also estimate your market share by comparing your monthly sales (calculated from your BSR) with the combined sales of your top competitors. For example, if your estimated monthly sales are $10,000 and your top 10 competitors collectively generate $100,000, your market share would be around 9% of that segment. Tracking these ratios over time helps you determine whether you’re gaining or losing ground as market dynamics evolve.
Next, we’ll dive into Sales Velocity to uncover more insights into competitor performance.
2. Sales Velocity
Relevance to Competitor Sales Estimation
Sales velocity tracks how quickly products are selling, offering a dynamic view of market momentum. Unlike the static snapshot provided by BSR, sales velocity helps identify whether a competitor's sales are picking up speed, slowing down, or holding steady. This is crucial because Amazon's algorithm tends to favor fast-selling products for better Buy Box placement and higher organic rankings. Products with strong sales velocity often gain more visibility and conversions, creating a feedback loop where momentum drives even greater success. This makes sales velocity a powerful tool for spotting trends and gauging long-term performance shifts.
Ease of Data Collection and Tracking
Monitoring sales velocity requires consistent tracking. Thankfully, modern analytics tools simplify this process by analyzing historical BSR data to estimate how quickly competitors are moving inventory. Tools like the Canopy API streamline this further, offering GraphQL and REST endpoints (https://rest.canopyapi.co/ and https://graphql.canopyapi.co/) that automate data collection. By integrating these APIs into your workflow, you can track competitor rankings over time, calculate week-over-week velocity trends, and set up alerts for major changes. This automation eliminates manual efforts, allowing you to respond faster to market shifts and make more informed decisions - all while staying aligned with real-time data, as previously discussed with BSR.
Impact on Sales Performance Insights
Week-over-week changes in sales velocity are often more telling than absolute numbers. For instance, a competitor might maintain a steady BSR but show declining velocity, hinting at weakening demand. On the flip side, improving velocity could signal that a product is gaining ground and might soon surpass better-ranked competitors. A sharp drop in velocity could indicate issues like losing the Buy Box or heightened competition. Since sales velocity can also vary seasonally, comparing performance within the same season rather than across different periods provides more accurate insights and helps avoid inventory mismanagement.
Actionability for Competitive Strategies
High sales velocity often means rapid turnover and frequent restocking. If a competitor starts running low on stock, a decline in their velocity could signal an opportunity to capture market share. Combining sales velocity with pricing and review data gives a fuller picture. For example, a competitor with high velocity and rising prices might indicate strong demand, while high velocity paired with falling prices could suggest an aggressive play for market share. This integrated approach helps refine competitive strategies. Up next, let’s dive into how pricing trends add even more depth to competitor analysis.
3. Pricing Trends
Relevance to Competitor Sales Estimation
Pricing trends go hand-in-hand with metrics like Best Sellers Rank (BSR) and sales velocity to paint a clearer picture of market activity. They show how competitors tweak their pricing to either grab market share or boost profit margins. For instance, during peak seasons, price drops of 15–25% are often used to accelerate sales and secure the coveted Buy Box. On the other hand, when prices stay steady or even rise without a dip in BSR, it’s a sign of strong demand and solid profit margins. By tracking pricing changes over time, you can identify which price points trigger sales spikes. Observing when competitors lower their prices helps you plan counterstrategies effectively. Combined with BSR data, pricing becomes a powerful tool for estimating sales and understanding the market.
Ease of Data Collection and Tracking
Tracking pricing trends has never been easier thanks to modern tools. Browser extensions, for example, can display historical price data directly on product pages. For larger-scale tracking, the Canopy API provides REST and GraphQL endpoints to access real-time pricing and historical trends. Here’s a simple JavaScript snippet to fetch pricing data:
fetch('https://rest.canopyapi.co/products?asin=B08N5WRWNW&key=YOUR_API_KEY')
  .then(response => response.json())
  .then(data => console.log('Current Price:', data.price, 'Trends:', data.price_history))
  .catch(error => console.error('Error:', error));
This API call retrieves the current price in USD along with historical pricing trends, making it easy to spot patterns like weekly fluctuations or seasonal changes. Automating this process ensures consistent tracking, allowing you to align your pricing strategies with broader market trends.
Impact on Sales Performance Insights
Pricing trends offer valuable insights into how demand and competition interact. For example, dynamic pricing strategies can increase sales velocity by 20–30%, whereas isolated price drops of 10–15% can distort sales estimates by a similar range.
Actionability for Competitive Strategies
Studying pricing trends can guide smart tactical moves. Let’s say a competitor’s average order value dips below $25 due to discounts - you could respond by bundling products to capture higher-margin sales. Similarly, during periods of slow sales, undercutting competitors’ prices by 5–10% might help you gain additional Buy Box share. However, it’s crucial to balance pricing with profitability. Monitoring contribution margins per SKU ensures you’re scaling only profitable items - chasing sales at the expense of margins can backfire. Additionally, watching how pricing aligns with inventory levels can be revealing. If a competitor suddenly slashes prices, it might indicate a clearance strategy, giving you the chance to maintain higher prices and attract their customers.
Next, we’ll dive into how review count and rating can further sharpen your competitor analysis.
4. Review Count and Rating
Relevance to Competitor Sales Estimation
Review counts and star ratings are more than just customer feedback; they’re a snapshot of how well a product is performing in the market. Amazon’s star rating system factors in things like how recent a review is and whether it comes from a verified purchase, giving a clearer picture of current performance. For competitor analysis, steady growth in reviews often signals strong sales momentum, while stagnant or declining numbers might hint at waning interest. When paired with metrics like Best Sellers Rank (BSR) and pricing, review data helps create a fuller understanding of market dynamics and competitive performance.
Ease of Data Collection and Tracking
Thanks to modern APIs, tracking competitor reviews has become much simpler. For instance, the Canopy API provides access to review data for over 350 million Amazon products across more than 25,000 categories. Here’s a quick example of how you can use JavaScript with the REST endpoint to pull review data:
fetch('https://rest.canopyapi.co/products?asin=B08N5WRWNW&key=YOUR_API_KEY')
  .then(response => response.json())
  .then(data => console.log('Reviews:', data.review_count, 'Rating:', data.rating))
  .catch(error => console.error('Error:', error));
This snippet retrieves real-time review counts and ratings. You can also use search endpoints to gather review metrics across broader categories or specific keyword searches, making it easier to analyze competition on a larger scale.
Impact on Sales Performance Insights
Review data isn’t just a reflection of customer satisfaction - it’s a tool for spotting trends and making quick adjustments to product listings. AI tools can even summarize reviews, highlighting common themes and customer sentiment so you can quickly zero in on product strengths and weaknesses. Verified purchase reviews are especially important since they carry more weight in Amazon’s ranking system, providing more reliable insights. Keeping an eye on recent reviews can also help you detect shifts in quality, like a rise in negative feedback, which might point to emerging issues.
Actionability for Competitive Strategies
If a competitor’s rating suddenly drops, it could be the perfect moment to tweak your advertising strategy or roll out targeted promotions. By combining review growth data with sales estimates, you can get a clearer picture of market share. For example, if review growth slows while BSR worsens, it might signal declining sales - an opportunity to capture that segment. Tools like automated AI sentiment tracking make it easier to respond quickly to these kinds of market changes. Overall, review trends are a powerful piece of the puzzle when it comes to building a comprehensive competitor analysis.
5. FBA Offer Count
Relevance to Competitor Sales Estimation
FBA Offer Count is a key metric for analyzing competitor sales. It tells you how many sellers are using Fulfillment by Amazon (FBA) to sell the same product under a specific ASIN. Why does this matter? Because it directly impacts Buy Box competition. The more FBA sellers on a listing, the more sales get divided among them. In competitive niches, the top FBA offers might snag 60–80% of total sales, leaving the rest to split what's left. For example, if you're one seller among five, your market share is much larger than if you're one among twenty. Products with 1–3 FBA sellers often have higher sales potential per seller, while listings with 10 or more sellers see sales spread thinly across many competitors.
Ease of Data Collection and Tracking
Collecting FBA Offer Count data is quick and straightforward. You can manually check the number of FBA listings on a product page, which takes less than a minute per ASIN. For larger-scale tracking, APIs make the process seamless. Here's an example using JavaScript and a REST API:
fetch('https://rest.canopyapi.co/products/B08N5WRWNW?includes=offers&key=YOUR_API_KEY')
  .then(response => response.json())
  .then(data => {
    const fbaOffers = data.offers.filter(offer => offer.fulfillment_type === 'FBA');
    console.log('FBA Offer Count:', fbaOffers.length);
  })
  .catch(error => console.error('Error:', error));
This code fetches real-time offer data and filters it to display only FBA sellers. Using such tools allows you to efficiently track competitor activity across multiple ASINs, making it easier to pair this data with metrics like BSR and pricing for a more complete analysis.
Impact on Sales Performance Insights
FBA Offer Count has a direct impact on sales performance. A higher number of FBA sellers usually means lower sales per seller due to increased competition for the Buy Box. For instance, if a product with a Best Sellers Rank (BSR) indicates 500 monthly sales and there are 10 FBA offers, each seller might average 50 units per month. However, Buy Box winners often outperform others by 5–10×. By combining FBA counts with BSR data, you can identify which sellers are dominating sales. Additionally, a sudden spike in FBA counts might signal growing market saturation, which could lead to reduced sales volumes for individual sellers.
Actionability for Competitive Strategies
Regularly tracking FBA Offer Count can help you identify opportunities and refine your competitive strategy. Focus on niches with fewer than five FBA sellers, as these typically offer better sales potential. Listings with just 1–3 FBA sellers can deliver 2–3× higher profitability compared to those with 10 or more sellers. If you notice a competitor's FBA count rising, consider proactive measures like creating product bundles or increasing your PPC ad spend. Setting up API alerts to track changes in FBA counts can also help you respond quickly to shifts in the market, such as competitor stockouts or increasing competition. By staying on top of this metric, you'll be better positioned to adapt and succeed in a competitive landscape.
6. Average BSR Over Time
Why It Matters for Competitor Sales Estimation
Looking at hourly BSR snapshots can sometimes give a skewed view of a product's performance. By averaging BSR over a longer period, you get a clearer picture of actual sales trends. For instance, a product with a stable BSR over several weeks or months likely has consistent sales, while a product with a wildly fluctuating BSR might be experiencing temporary demand spikes from promotions or limited-time deals. To illustrate, a BSR of 100,000 might equate to 150–200 monthly sales in the Books category but only 30–40 sales in Home & Kitchen. Without averaging, short-term promotional boosts could be mistaken for sustainable performance. This long-term view works well alongside other data points like pricing trends and FBA inventory counts.
How to Track and Automate Average BSR
Tracking average BSR over time doesn’t have to be a manual process. Using APIs, you can automate data collection by polling product information at regular intervals. Below is an example of how you can use JavaScript with a GraphQL API to monitor BSR over time:
const query = `
  query GetProductBSR($asin: String!) {
    product(asin: $asin) {
      asin
      title
      salesRank {
        rank
        category
      }
      lastUpdated
    }
  }
`;

fetch('https://graphql.canopyapi.co/', {
  method: 'POST',
  headers: {
    'Content-Type': 'application/json',
    'API-Key': 'YOUR_API_KEY'
  },
  body: JSON.stringify({
    query: query,
    variables: { asin: 'B08N5WRWNW' }
  })
})
  .then(response => response.json())
  .then(data => {
    console.log('Current BSR:', data.data.product.salesRank.rank);
    console.log('Category:', data.data.product.salesRank.category);
  })
  .catch(error => console.error('Error:', error));
This method helps you build a dataset of BSR values over 30 to 90 days, giving you a reliable baseline to evaluate trends.
Gaining Deeper Insights Into Sales Performance
Averaging BSR over time uncovers patterns that single snapshots simply can’t show. For example, temporary stockouts or short-lived promotions can distort a competitor’s rank because Amazon’s algorithm heavily weighs recent sales velocity. By looking at historical data, you can also account for seasonal trends - like holiday shopping spikes or demand changes tied to specific times of the year. Combining this averaged data with other metrics, such as pricing trends or FBA offer counts, gives you a fuller picture of whether a competitor’s performance is steady or just experiencing a temporary boost.
Using BSR Trends to Shape Competitive Strategies
Tracking BSR trends over a 30-to-90-day period can help you separate real growth from temporary fluctuations. APIs like Canopy API make it easier by offering access to data on over 350 million Amazon products across 25,000 categories. If you notice a competitor’s average BSR steadily improving, it likely signals growing market share, which might prompt you to adjust your pricing or ramp up advertising efforts. On the other hand, erratic BSR trends could indicate issues like inventory struggles or inconsistent demand - potential opportunities for you to capture their customers. Pair these insights with other metrics to fine-tune your competitive strategy.
7. Estimated Monthly Sales Volume
Understanding Competitor Sales
Estimated monthly sales volume tells you how many units a competitor sells each month. Unlike Best Sellers Rank (BSR), which requires some interpretation, this metric provides a straightforward way to measure performance. For instance, Jungle Scout's estimator showed that a dog chew toy ranked #516 in Pet Supplies had an estimated 11,640 monthly sales on Amazon US. This kind of data helps you assess market demand, set achievable goals, and decide whether a niche is worth pursuing. It’s a key factor in aligning your inventory with actual market needs.
Gathering and Tracking Sales Data
Getting sales volume estimates is relatively simple, especially with tools that use APIs. Free browser extensions can instantly display estimates on product pages when you input an ASIN and its BSR. For more detailed and accurate results, APIs that combine keyword volume, conversion rates, and BSR data are highly effective. Canopy API, for example, offers real-time sales estimates for over 350 million Amazon products across more than 25,000 categories through its REST and GraphQL endpoints. Here’s a quick example of how you can use the REST API in JavaScript:
fetch('https://rest.canopyapi.co/sales-estimates?asin=B08N5WRWNW', {
  headers: { 'Authorization': 'Bearer YOUR_API_KEY' }
})
  .then(response => response.json())
  .then(data => {
    console.log('Estimated Monthly Sales:', data.monthlySalesEstimate);
  })
  .catch(error => console.error('Error:', error));
While these tools make data collection easier, the estimates can fluctuate because BSR is constantly changing. This means the data is easier to access than direct sales figures, but it might not always be perfectly accurate.
Gaining Insights into Market Performance
Sales volume data offers a clear view of market share and competitor performance. When paired with inventory levels and pricing trends, it paints a fuller picture of how competitors operate. For example, if a competitor consistently sells around 1,000 units per month while maintaining steady pricing, it’s a sign of a strong supply chain and a loyal customer base. Tracking this data over time can also help you identify seasonal trends and predict growth patterns.
Using Sales Data for Strategy
Sales volume insights can guide you in optimizing your inventory. You can align stock levels with peak demand periods and avoid overstocking during slower months. If your top competitors are selling around 1,000 units monthly, you might consider strategies like bundling products to increase your average order value and gain market share. Comparing your sales volumes with competitors can also help you fine-tune your pricing strategies. Additionally, monitoring competitors’ stock levels alongside their sales estimates can reveal when they might run low on inventory - giving you a chance to capture their customers during those gaps.
sbb-itb-d082ab0
8. Buy Box Ownership
Relevance to Competitor Sales Estimation
When it comes to understanding market demand, tracking Buy Box ownership is an essential tool. As we’ve discussed sales velocity and pricing trends, this metric adds another layer of insight. Buy Box ownership measures how often a seller secures the primary sales channel on Amazon, which is crucial because most Amazon purchases happen through the Buy Box. If a competitor dominates the Buy Box, they’re likely capturing the lion’s share of sales for that product. Keeping an eye on who controls the Buy Box can reveal a lot about current market dynamics.
For instance, if you notice a competitor’s Buy Box percentage suddenly drops, it could mean they’ve lowered their price, run out of stock, or are dealing with account health problems like a high Order Defect Rate (ODR). Understanding these shifts in Buy Box dynamics can help you better assess how they influence sales performance.
Impact on Sales Performance Insights
Losing the Buy Box doesn’t just cut into sales - it can also hurt a product’s organic ranking and make it ineligible for promotions. Amazon’s algorithm decides who gets the Buy Box based on several factors, not just price. Metrics like sales velocity, conversion rates, and account health all play a role. For example, sellers must maintain an ODR under 1% to keep their Buy Box eligibility and avoid potential account suspension.
Here’s a quick breakdown of key metrics and their impact on Buy Box performance:
| Metric | Benchmark/Limit | Impact on Buy Box |
|---|---|---|
| Order Defect Rate (ODR) | Under 1% (Aim for <0.5%) | A high ODR can result in losing Buy Box eligibility. |
| Inventory Performance Index (IPI) | Above 450 (Aim for 550+) | Low IPI can lead to storage limits, stockouts, and loss of Buy Box control. |
| Unit Session Percentage | 8–15% (Depends on category) | Higher conversion rates increase the chance of winning the Buy Box. |
Actionability for Competitive Strategies
To stay ahead, monitor your Buy Box percentage regularly - at least once a week. This helps you spot trends in competitor dominance or uncover vulnerabilities. If a competitor’s Buy Box ownership suddenly drops, dig deeper. Have they lowered their prices? Are they facing account health issues? Using APIs to track competitor stock levels and pricing can also reveal opportunities. For example, if a competitor’s inventory is running low, they’re more likely to lose the Buy Box, opening the door for you to capture their customers.
Here’s an example of how an API can help you gather actionable data:
fetch('https://rest.canopyapi.co/product?asin=B08N5WRWNW', {
  headers: { 'Authorization': 'Bearer YOUR_API_KEY' }
})
  .then(response => response.json())
  .then(data => {
    console.log('Buy Box Price:', data.buyBoxPrice);
    console.log('Buy Box Seller:', data.buyBoxSeller);
    console.log('Stock Status:', data.availability);
  })
  .catch(error => console.error('Error:', error));
If your conversion rate falls below 8%, focus on improving your price positioning and optimizing your main product image before ramping up ad spend. Additionally, keep an eye on competitor promotions. Timing your counter-promotions strategically can maximize their impact.
9. Inventory Levels and Restock Frequency
Relevance to Competitor Sales Estimation
Tracking inventory levels and restock frequency adds an extra layer of insight when estimating competitor sales. This data helps you gauge how quickly competitors are moving products. For instance, if a seller restocks every two weeks instead of once a month, it’s a strong indicator of steady, high-volume sales and a faster sales velocity. Monitoring stock in real time also highlights moments when competitors face stockouts - periods when their products are unavailable. These gaps can be golden opportunities to attract their customers who are left searching for alternatives. Together with metrics like pricing and Buy Box data, inventory tracking provides a clearer picture of supply dynamics.
Ease of Data Collection and Tracking
APIs like Canopy API make it simple to collect and monitor inventory data. They provide structured, real-time updates on stock levels, pricing, and sales estimates, so you don’t need to rely on manual checks or build custom scrapers. Canopy API, for example, offers access to inventory information for over 350 million Amazon products across 25,000 categories.
Here’s a quick comparison of your options:
| Feature | Managed API (e.g., Canopy API) | Custom Scraping |
|---|---|---|
| Reliability | High; maintained by provider | Low; prone to breaking |
| Data Types | Stock levels, pricing, sales estimates | Limited to visible page data |
| Installation Time | Minutes (REST/GraphQL) | Days or weeks to develop |
| Scalability | High; pay-as-you-go pricing | Low; requires extra infrastructure |
"Time is a precious resource, do not spend it maintaining your Amazon scraper, invest in a reliable API!" - Canopy API
Impact on Sales Performance Insights
Inventory data doesn’t just simplify tracking - it also provides key sales insights. When combined with other metrics, it becomes a powerful analytical tool. For example, a "Low Stock" warning alongside a high Best Sellers Rank indicates strong demand. On the other hand, a "Currently Unavailable" status after steady sales could signal a major sales surge that the competitor’s supply chain couldn’t keep up with. Comparing restock cycles, such as a 10-day cycle versus a monthly one, can also highlight supply chain efficiency and uncover actionable trends.
Actionability for Competitive Strategies
Automating stock checks through API calls can streamline your strategy. Set up alerts to monitor competitors’ stock levels daily, and act immediately when they run low or sell out. For example, using Canopy API’s REST endpoint, you can track availability like this:
fetch('https://rest.canopyapi.co/product?asin=B08N5WRWNW', {
  headers: { 'Authorization': 'Bearer YOUR_API_KEY' }
})
  .then(response => response.json())
  .then(data => {
    console.log('Stock Status:', data.availability);
    console.log('Available Quantity:', data.availableQuantity);
    console.log('Last Restock Date:', data.lastRestockDate);
  })
  .catch(error => console.error('Error:', error));
When a competitor runs out of stock, consider raising your ad bids to capture their customers. You might even implement a temporary price increase to maximize profits while competition is minimal. Additionally, tracking stock depletion over time can help estimate monthly sales. For instance, if a competitor’s inventory drops from 500 to 350 units in a week, you can infer they’re selling around 600 units per month.
10. Canopy API
Relevance to Competitor Sales Estimation
The Canopy API brings together essential metrics - like BSR (Best Seller Rank), pricing trends, reviews, FBA counts, and sales estimates - into a single, streamlined solution. It provides real-time sales estimates for any competitor's ASIN, eliminating the need for custom scrapers or fragile automation setups. This unified approach simplifies integration into your analytics workflow, offering a hassle-free way to stay on top of competitor data.
Ease of Data Collection and Tracking
The API supports both GraphQL (https://graphql.canopyapi.co/) and REST (https://rest.canopyapi.co/), making it versatile and easy to integrate. Here's an example of how you can use GraphQL to fetch key data like BSR and sales estimates:
const query = `
  query GetCompetitorData($asin: String!) {
    product(asin: $asin) {
      asin
      bestSellerRank
      estimatedSales
      price
      reviewCount
      rating
    }
  }
`;

fetch('https://graphql.canopyapi.co/', {
  method: 'POST',
  headers: {
    'Content-Type': 'application/json',
    'Authorization': 'Bearer YOUR_API_KEY'
  },
  body: JSON.stringify({
    query,
    variables: { asin: 'B08N5WRWNW' }
  })
})
  .then(res => res.json())
  .then(data => console.log(data.data.product))
  .catch(error => console.error('Error:', error));
The platform processes over 10,000 daily cache hits, ensuring fast and reliable data retrieval. Pricing starts with a free Hobby plan, which includes 100 requests per month.
Impact on Sales Performance Insights
By consolidating data, the Canopy API goes beyond providing raw numbers - it delivers AI-driven insights that help identify trends and opportunities. For example, combining historical BSR data with sales estimates can reveal seasonal demand patterns, shifts in consumer behavior, or gaps in performance that manual analysis might overlook. Imagine spotting a competitor's BSR climbing from #1,000 to #500 in Electronics while their review count remains steady. This could signal a targeted promotion driving sales rather than organic growth. Additional metrics like Buy Box ownership and FBA offer counts further enhance the understanding of competitor strategies.
Actionability for Competitive Strategies
The Canopy API enables actionable insights by delivering automated alerts that help you respond quickly to market changes. For instance, if the API detects a competitor's price drop or stock shortage, you can adjust your pricing, ramp up ad spending, or launch a promotion to stay competitive. The Search endpoint also lets you monitor keyword rankings, so if a competitor starts ranking higher for terms like "wireless earbuds", you can analyze their listing optimization or advertising tactics. With continuous tracking, you can turn competitor analysis into a proactive strategy that keeps you ahead of the curve.
Competitor Analysis on Amazon For An Extra 300+ Sales / Month - Research & Analyse Competitors
Using Canopy API for Competitor Analysis
Here's how you can harness the Canopy API for competitor analysis. Start by signing up, grabbing your API key, and adding it to your request headers. You can use either API-KEY: YOUR_API_KEY or Authorization: Bearer YOUR_API_KEY. Canopy offers both REST and GraphQL endpoints, giving you the flexibility to choose based on your technical needs. For straightforward lookups, use the REST endpoint at https://rest.canopyapi.co/api/amazon/product. For more complex, nested queries, the GraphQL endpoint at https://graphql.canopyapi.co/ is the way to go.
Here’s a practical example in JavaScript to fetch competitor data using the REST endpoint:
const fetchCompetitorData = async (asin) => {
  const url = `https://rest.canopyapi.co/api/amazon/product?asin=${asin}&domain=US`;
  try {
    const response = await fetch(url, {
      method: 'GET',
      headers: {
        'API-KEY': 'YOUR_API_KEY',
        'Content-Type': 'application/json',
      },
    });
    if (response.ok) {
      const data = await response.json();
      console.log('Pricing:', data.price);
      console.log('Review Count:', data.review_count);
      console.log('Sales Estimate:', data.sales_estimate);
      console.log('Stock Level:', data.stock_level);
    }
  } catch (error) {
    console.error('Error fetching data:', error);
  }
};
This simple example shows how easily you can integrate the API into your workflow to enhance your competitive strategy. The Canopy API provides access to a massive database spanning over 350 million Amazon products across 25,000+ categories, with more than 10,000 daily cache hits ensuring reliable and up-to-date data retrieval. Pricing is scalable, making it a practical solution whether you're monitoring a few competitors or tracking hundreds of ASINs daily. More details on pricing plans are available in Section 10.
To stay ahead, track inventory fluctuations - a key metric for estimating sales velocity. By monitoring daily changes in the stock_level field and comparing them with sales_estimate data, you can calculate actual sales volume. Combining this with pricing and sales data helps you identify market gaps and refine your strategy. Canopy replaces unreliable scrapers with a robust managed service, as highlighted by the company:
"APIs replace fragile scrapers for finding real-time prices, discounts, and sales estimates across millions of products".
The API goes beyond basic data. Specialized tools like the Search API allow you to track competitors’ keyword rankings, essential for understanding how visibility impacts sales. Meanwhile, the Deals API monitors real-time promotions and price adjustments, so you can respond quickly when competitors change tactics. For advanced users, the MCP Server integrates Amazon data with AI tools like ChatGPT, enabling automated workflows for competitive analysis and reporting.
Conclusion
The metrics discussed above offer a solid foundation for estimating competitor sales on Amazon. By analyzing these data points, you can uncover demand trends, set performance benchmarks, and understand market shifts - insights that guessing simply can't provide. For instance, combining fluctuations in Best Sellers Rank (BSR) with sales velocity allows you to predict seasonal demand and fine-tune inventory before your competitors even notice.
When managing more than just a handful of ASINs, manual tracking quickly becomes impractical. With 89% of top Amazon sellers now relying on advanced analytics tools to drive growth, automation has become essential. It's no longer a luxury but a necessity in a marketplace expected to account for 60% of U.S. online sales by 2026.
To streamline your efforts, use the REST endpoint at https://rest.canopyapi.co/ for quick lookups or the GraphQL endpoint at https://graphql.canopyapi.co/ for more in-depth queries across various metrics. Consider building a dashboard to track your BSR velocity against competitors on a weekly basis - this can provide a lasting advantage in pricing strategies and inventory management.
Real-time tracking not only reduces errors but also enables you to adapt strategies proactively. For example, monitoring competitors' stock levels can help you identify when they're running low, allowing you to adjust pricing or ramp up ad spend to attract their customers. Similarly, tracking review sentiment can reveal common complaints in competitor listings, giving you the opportunity to emphasize how your product addresses those issues.
FAQs
How can you use Best Sellers Rank (BSR) to estimate a competitor's sales accurately?
Best Sellers Rank (BSR) serves as a handy metric for gauging sales performance. Generally, the lower the BSR, the higher the sales volume. By keeping an eye on a competitor’s BSR over time and factoring in conversion data specific to their product category, you can get a good estimate of how many units they’re selling. Consistently tracking changes in their rank can also reveal trends and seasonal patterns, giving you a better understanding of their sales activity.
Why is sales velocity important for tracking market trends on Amazon?
Sales velocity tracks how fast a product sells within a given timeframe. It’s a useful metric for spotting changes in customer demand and identifying new trends in the market. By digging into sales velocity, businesses can gain insights into customer preferences, seasonal fluctuations, and how well their products are performing.
Keeping an eye on this metric helps companies make smarter decisions, like tweaking pricing strategies or exploring opportunities to broaden their product lineup.
How do pricing trends impact competitor analysis and sales strategies?
Pricing trends are a key component of competitor analysis, offering a window into how rivals adapt their prices based on market demand, seasonal shifts, or promotional campaigns. By keeping an eye on these patterns over time, you can uncover strategies like frequent discounts - possibly signaling a price war - or steady premium pricing, which may point to a strong brand presence. These observations can guide your decisions on whether to adjust your own pricing, maintain a high-value position, or set yourself apart in other ways.
Access to real-time pricing data lets you respond swiftly to these trends. For instance, you can implement dynamic pricing systems, fine-tune your ad spend when a competitor drops their prices, or plan inventory restocks to avoid running out of stock during price surges. Leveraging tools like APIs to track competitor prices keeps you agile, ensuring your decisions are grounded in data. This approach helps safeguard your profit margins while optimizing your overall sales strategy.